Modulation in the hydrographic network of the dynamics of C-N-P exports in a mesoscale agricultural watershed
Antoine Casquin, Rémi Dupas, Patrick Durand (INRAE, SAS) and Sen Gu, Patrice Petitjean, Gérard Gruau (University of Rennes 1, CNRS, Géosciences Rennes) published in December 2020 in the journal STOTEN an article on modulation in the hydrographic network dynamics of CNP exports in a mesoscale agricultural watershed.
The majority of the world's terrestrial aquatic ecosystems are affected by eutrophication, that is, by nutrient enrichment - carbon (C), nitrogen (N) and phosphorus (P) - of the media. In agricultural landscapes, most of these nutrients come from crop fertilization. They are transferred via surface flows (especially P), subsurface (especially C and P) or the water table (especially N) from the slopes to the rivers. These transfers are generally studied in so-called “research” watersheds, which are elementary sub-watersheds of a few square kilometers. This scale does not correspond to the "operational" scale, or mesoscale at which water quality monitoring is carried out in the European Union (50-500 km2).
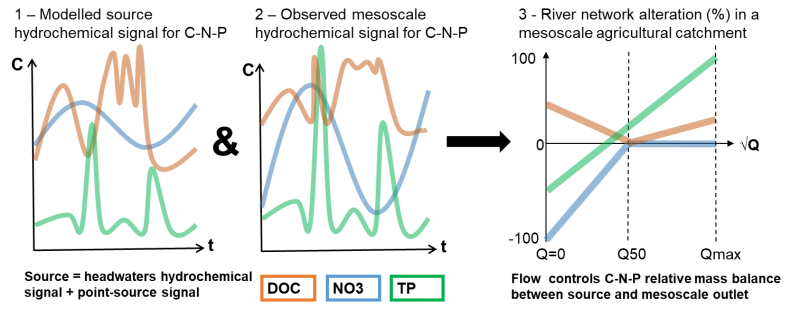
The main objective of this work was to quantify how "river" processes modify the dynamics of water exports of C-N-P under different conditions of flow, concentration and temperature at the outlet of a catchment area of "operational" size. Since the processes in slopes and rivers have common hydro-climatic factors, their relative influences on exports are difficult to distinguish. A methodological innovation based on repeated synoptic sampling (30 dates from March 2018 to April 2019) of 18 watershed heads in an intensive agricultural watershed of 300 km2 (Yvel, central Brittany) and spatialized stochastic modeling (Figure 2) a used to calculate a "source" signal from the slopes. We then calculated the apparent retention and creation of C-N-P in the hydrographic network (Figure 3) by difference with the concentrations measured at the outlet of the mesoscale watershed.

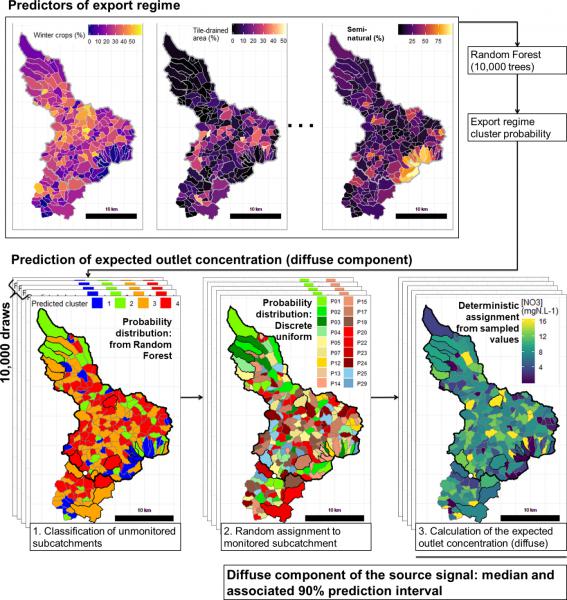
Figure 2. Steps in calculating the diffuse component of the source signal and the 90% prediction interval associated with it for an element at a given date. The example is based on the nitrate (NO3-) concentrations measured on April 24, 2018. On the map in the lower middle “P01 to P29” identifies the sampled sub-watersheds. The white dots on the maps represent the outlet of the mesoscale watershed. The thick lines delimit the sampled sub-watersheds and the mesoscale watershed.
The major result of this study was to show that the flow was the main factor controlling the modulations of CNP exports in the hydrographic network (Figure 3), while the temperature and the concentration of the sources had little or no influence.
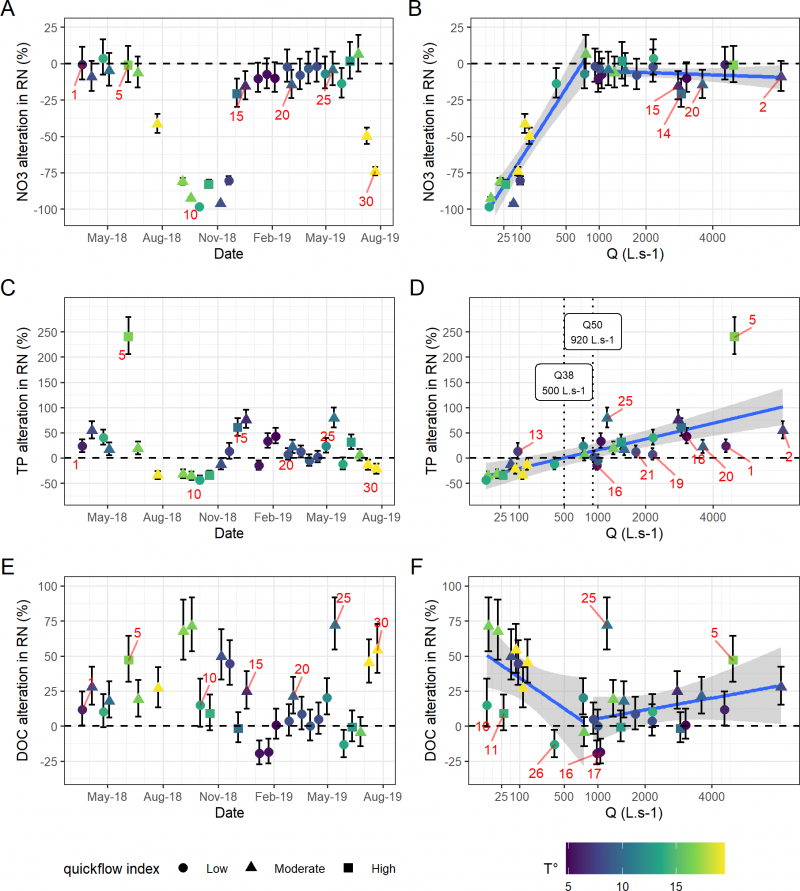
Figure3. Modulation in the hydrographic network (RN) of exports of Dissolved Organic Carbon (DOC), Nitrate (NO3-) and Total Phosphorus (TP) according to the sampling date (A, C and E) and the square gully of the average daily flow (Q) (B, D and E). Error bars represent 90% of the prediction interval from 10,000 simulations. The blue lines are linear regressions of the median alteration for Q below or above the long-term median of flow (Q50). The shape of the symbols indicates the proportion of "quickflow" at the time of sampling and their color the average air temperature for the previous 15 days.
The role of the hydrographic network on the flows of DOC, NO3- and TP is low on average over the year, it can be important in summer when the retention processes in the river are at their maximum. DOC is either produced in the hydrographic network or transported in a conservative manner but there is no apparent retention period. NO3- is consumed in the hydrographic network in low water, while P is temporarily stored in the sediment and is released from the first autumn / winter floods. The summer period being the most at risk for eutrophication, it may be interesting to take into account these river effects to reduce the flows of NO3- and P at this time of the year, by relocating crops upstream. the most nutrient exporters, for example.
Due to the differences in the rates of carbon and nutrient modulations in the hydrographic network, the stoichiometric ratios vary considerably between the catchment heads and the mesoscale catchment outlet, especially during the low water season, susceptible to eutrophication
Source